Webinar: Using Heat Maps to Protect Communities
Findings from our seven-council urban heat mapping pilot and direct insights from local authority teams.
Watch recording & details ↓Updates
Findings from our seven-council urban heat mapping pilot and direct insights from local authority teams.
Watch recording & details ↓High-resolution 30-metre heat mapping to identify vulnerable neighbourhoods, protect schools and care settings, and target urban greening.
Read case study ↓High-resolution 30-metre mapping to pinpoint local heat pockets, protect vulnerable residents, and identify cooling corridors.
Read case study ↓High-resolution 30-metre mapping revealing a 24°C variation across towns, suburbs, and countryside.
Read case study ↓How white roofs, green roofs, and reflective pavements can significantly reduce city overheating.
Read full article ↓Supporting climate adaptation and environmental justice during an unprecedented heatwave summer.
Read case study ↓Dual-purpose mapping to target overheating interventions and protect accessible community cooling spaces.
Read case study ↓Street-by-street heat intelligence for a dense coastal city to support tree planting and housing retrofit.
Read case study ↓Why rising temperatures threaten public health and why local spatial heat data is vital for rapid adaptation.
Read full article ↓Highlights from the CCC’s A Well-Adapted UK report warning of escalating summer mortality risk.
Read report summary ↓CAG Consultants and UHIx session exploring local urban heat mapping options and data access.
View slides & details ↓An update on how urban heat maps, generated using satellite data combined with cloud inpainting, are being used by local authorities to protect vulnerable communities.
We presented the findings from our urban heat mapping pilot, which involved producing maps showing how heat varies across neighbourhoods for seven councils — including districts, unitaries and counties. And we heard directly from some of the pilot councils about how they plan to use the data.
The London Borough of Richmond upon Thames has commissioned a high-resolution Urban Heat Index dataset to understand local temperature variations and strengthen the borough’s climate resilience.
As London’s climate warms, extreme heat is becoming one of the capital's most pressing environmental and public health challenges. The Greater London Authority’s (GLA) recent Heat Ready London report highlights the scale of the threat, warning that around one million London homes are already at high risk of overheating, alongside more than 1,300 schools, 60 hospitals, and 350 care homes located in high heat-risk areas. Projections indicate London could face two to three times as many heatwaves within the next twenty years.
Local authorities play a frontline role in responding to extreme heat through planning, housing standards, highways, public health, and parks management. However, taking targeted action requires street-level evidence. Broad regional averages often mask significant temperature differences between dense, built-up neighbourhoods and greener, open surroundings.
To provide Richmond with actionable spatial evidence, Urban Heat Index developed a GIS-ready data layer combining high-resolution satellite-derived land surface temperatures with information on vegetation, topography, and the built environment.
The resulting dataset maps surface temperature differences across the borough at a granular 30-metre resolution, measuring how much hotter specific areas run compared to the baseline average of local cool vegetated spaces.
The map highlights distinct neighbourhood-scale hot spots where hard surfaces and dense development trap heat, providing council officers with the evidence needed to:
Because the data is supplied directly as a GIS layer, it integrates seamlessly into Richmond’s existing mapping infrastructure, supporting collaborative action across public health, emergency planning, highways, and environmental services.
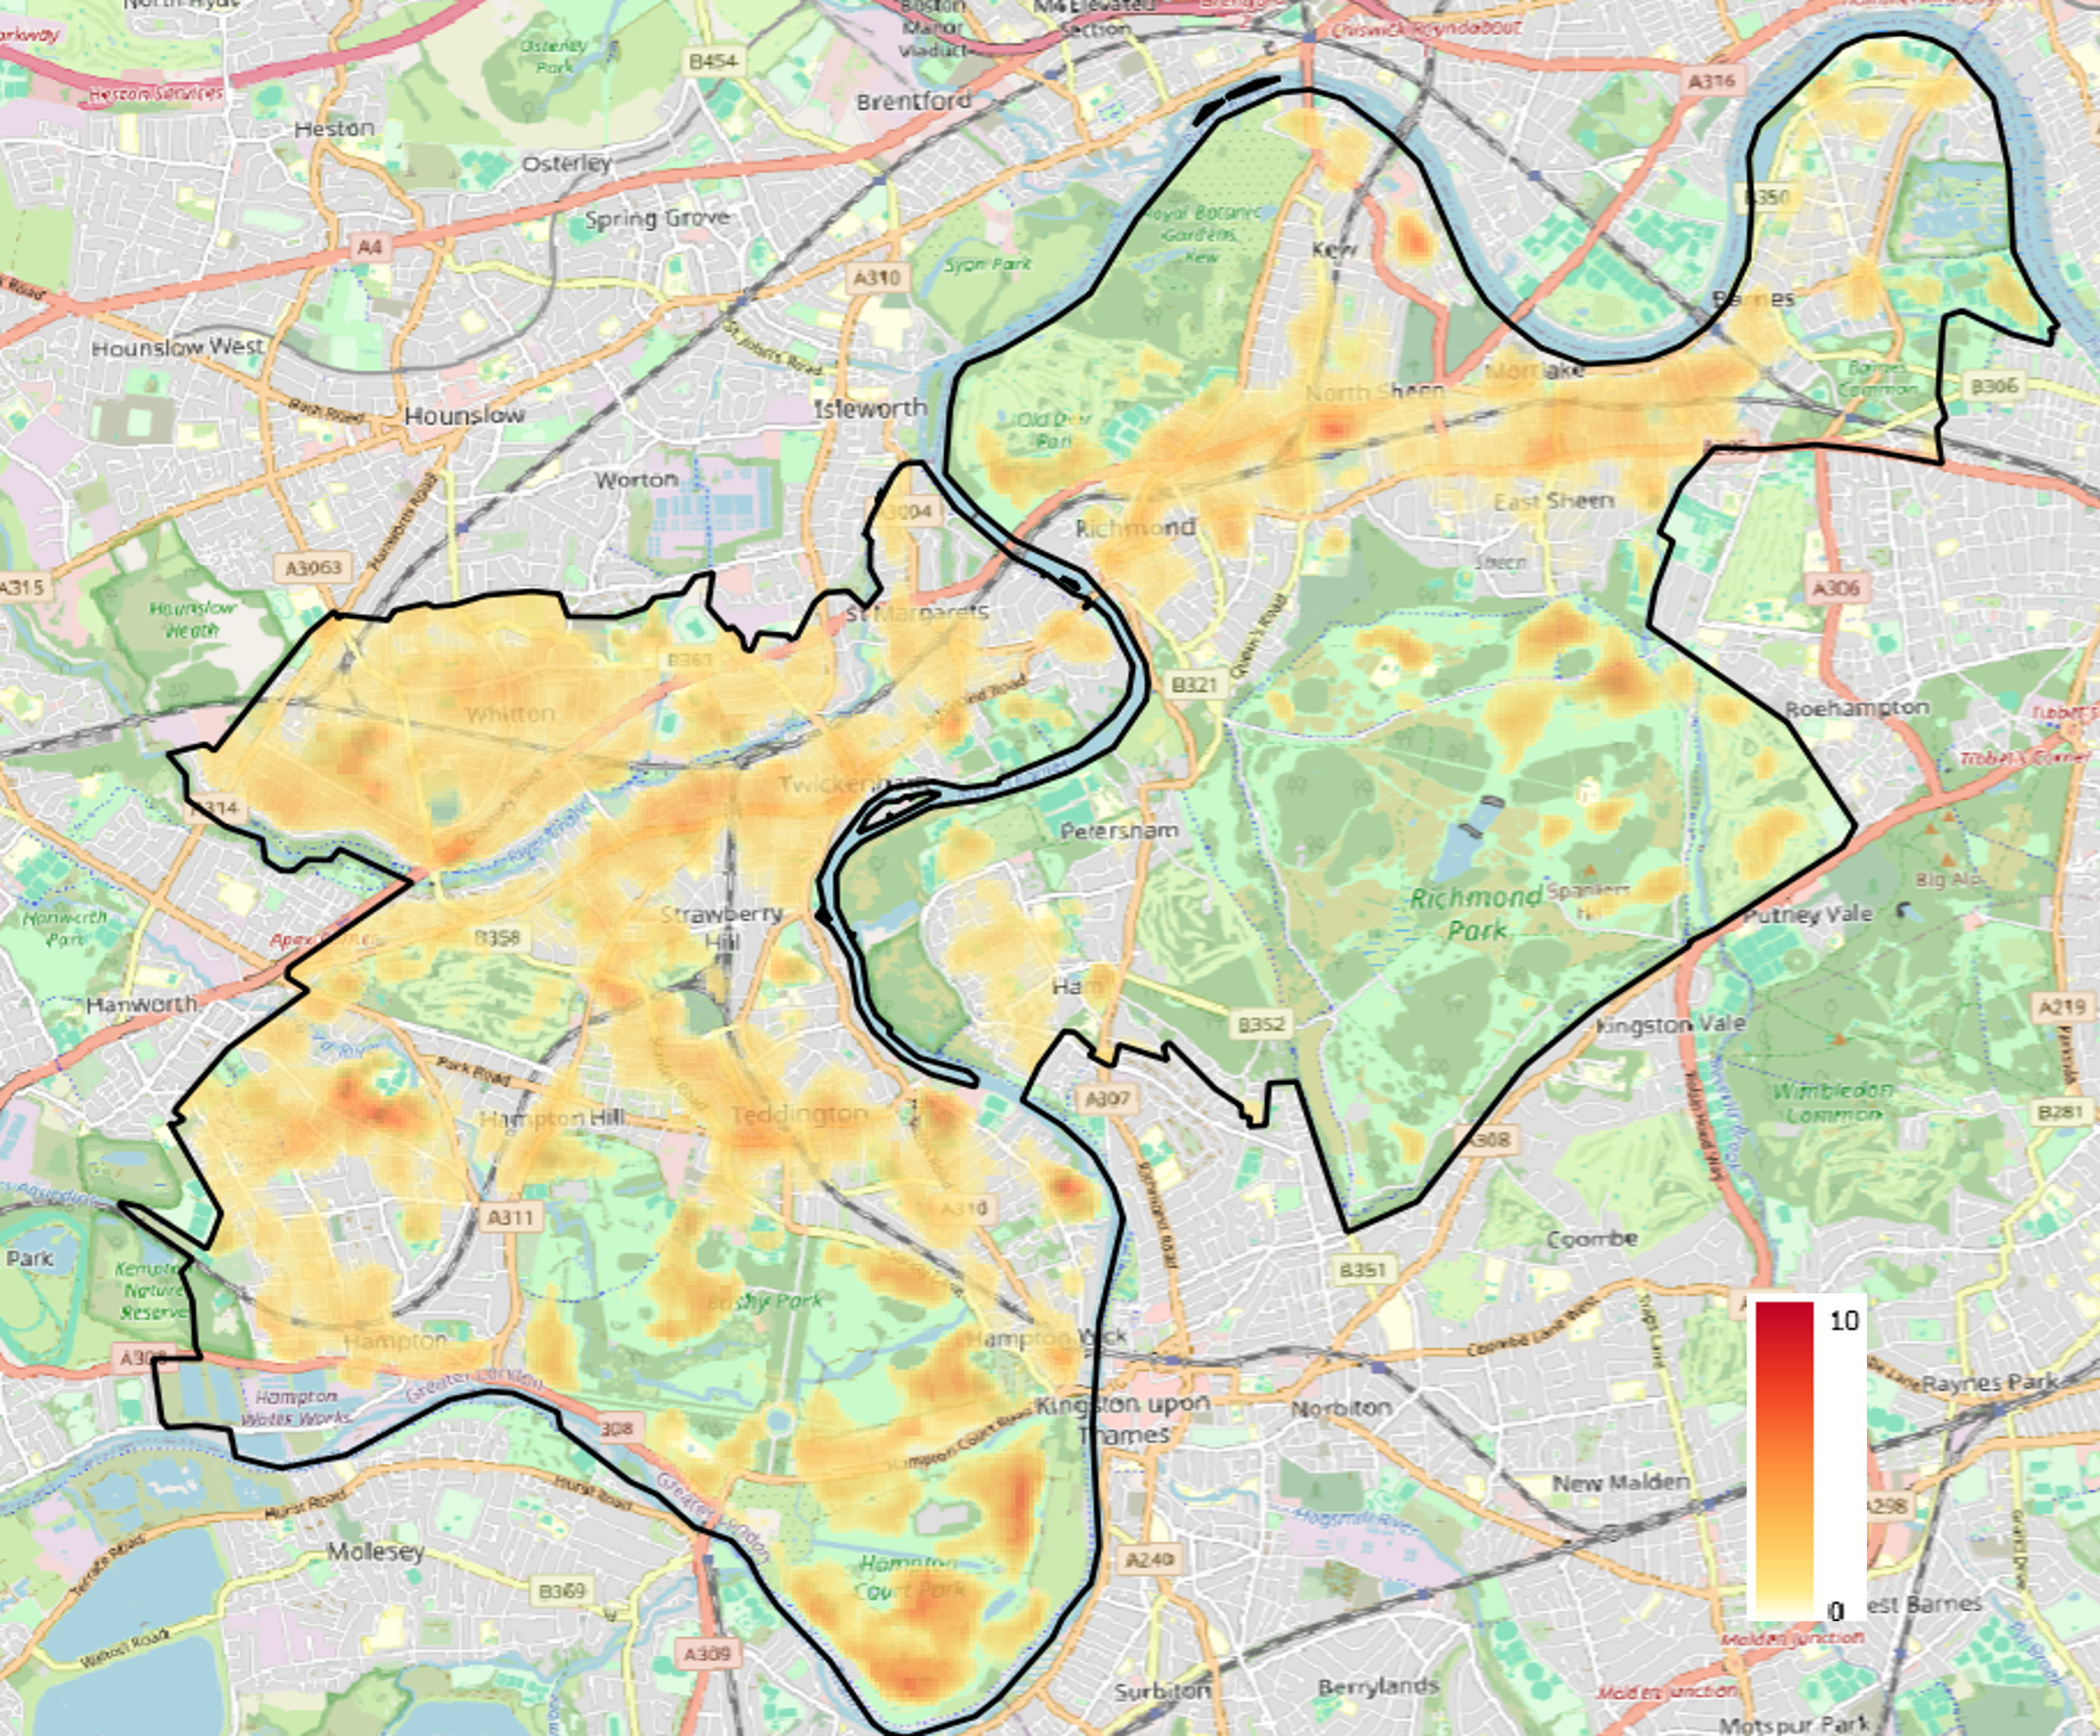
Urban Heat Index map for the London Borough of Richmond, showing surface temperatures relative to the average of cool vegetated areas at 30-metre resolution.
Bedford Borough Council has commissioned a high-resolution Urban Heat Index dataset to understand how heat risk varies across the borough and to strengthen local climate adaptation.
Extreme heat is one of the UK’s fastest-growing climate risks, placing intense pressure on health and care services, transport, and public infrastructure. However, heat impacts are not felt evenly across communities. Building density, surface materials, and tree canopy cover create significant temperature variations between neighbourhoods, leaving some areas far more exposed than others during heatwaves.
To provide council teams with actionable, local evidence, Urban Heat Index combined satellite-derived land surface temperature data with information on vegetation, topography, and the built environment. Delivered as a GIS-ready dataset, the mapping integrates directly into Bedford’s existing systems, allowing multiple departments—including public health, planning, adult social care, and emergency planning—to share a single evidence base.
The mapping provides a detailed view of temperature patterns at a 30-metre resolution. As illustrated in the figure below, this granular pixel detail allows officers to identify specific neighbourhood-scale heat pockets, while also highlighting the natural cooling influence of blue and green assets such as the River Great Ouse corridor.
Council teams are using the data to:
“This data set helps us to understand where heat is affecting our communities the most and allows us to better plan and mitigate for these impacts, particularly for more vulnerable people in our communities such as older people, young children, and those with existing health conditions.”
— Charlotte Ball, Public Health Manager (Healthy Places), Bedford Borough Council
“This pilot study has given us the local data we need to see where our neighbourhoods heat up the most. By identifying these specific urban heat pockets, we are taking the first important steps to enable us to target green spaces and cooling solutions where our residents need them, helping our borough to adapt to a changing climate. This work will also inform targeted resilience work on our public spaces and infrastructure strategies to ensure they are fit for the future.”
— Cristina Vaduva, Energy & Water Technical Officer, Bedford Borough Council
The Bedford pilot highlights how neighbourhood-level heat mapping bridges the gap between high-level climate forecasts and practical, on-the-ground interventions that keep residents safe and build healthier places to live.
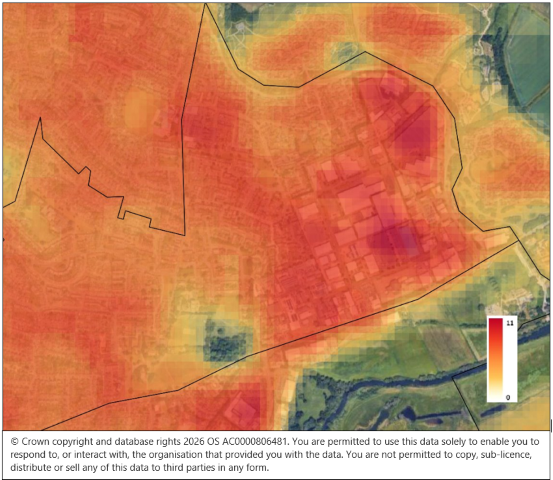
Detail from the Bedford Urban Heat Index map, showing temperature variations at 30-metre pixel resolution to pinpoint localised heat pockets and cooling corridors.
Surrey County Council has commissioned a high-resolution Urban Heat Index map to understand how temperatures vary across the county.
Unlike a densely built city, Surrey includes town centres, suburbs, villages, woodlands and open countryside. This varied landscape creates complex heat patterns that broad national datasets cannot show at neighbourhood level.
Urban Heat Index combined satellite-derived surface temperatures with information on vegetation, terrain and the built environment. The resulting Geographic Information System (GIS) layer maps temperature differences in 30-metre squares across the county.
The analysis found a 24°C difference between the hottest and coolest locations — a striking illustration of why county-wide averages can hide important local variations.
Surrey plans to use the data to support work on:
The project gives Surrey a detailed evidence base for targeting action across a large and varied county. It can help officers make informed decisions about planning, public health, schools and climate resilience.
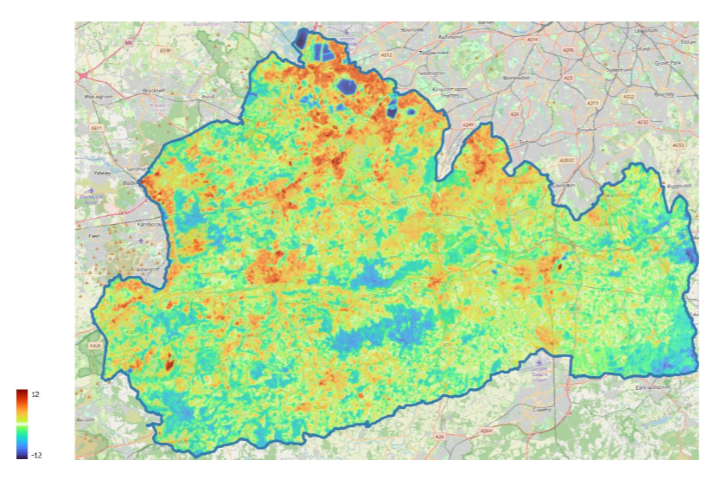
The Urban Heat Index map for Surrey, revealing temperature differences across the county’s towns, villages and countryside.
As the UK experiences more frequent and intense heatwaves, keeping our towns and cities cool is becoming an increasingly important challenge.
One of the most effective ways to reduce urban temperatures doesn’t involve installing expensive cooling systems. Relatively simple changes to the surfaces around us — such as installing green roofs, painting roofs white, or using lighter-coloured paving materials — can make a significant difference.
These measures help tackle one of the biggest drivers of overheating in cities: the urban heat island effect.
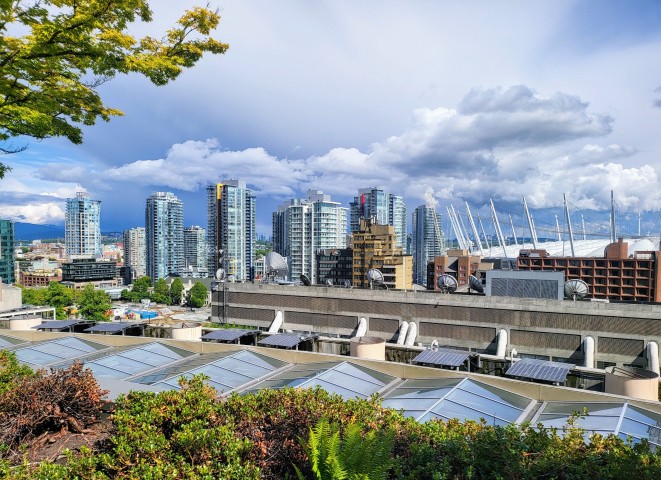
Buildings, roads and pavements absorb large amounts of the sun’s energy during the day. Dark materials such as asphalt and roofing felt are particularly good at storing heat, which they slowly release back into the surrounding air, especially during the evening and overnight.
This means that urban areas often remain several degrees warmer than the surrounding countryside, increasing health risks, reducing comfort and placing additional pressure on infrastructure and energy systems.
But the materials we choose for roofs, roads and pavements can help reduce this effect.
Research published in The Conversation explored how different roof types influence local air temperatures around London’s Victoria Station. The study found that:
Although they work in different ways, both approaches contribute to reducing the urban heat island effect. In practice, the best solution will depend on the characteristics of the building, maintenance requirements and wider environmental objectives.
Roofs are only part of the picture. Roads, pavements and other hard surfaces also cover a large proportion of our towns and cities.
An article published in Science Direct reported on a study that investigated the impact of using higher-reflectance paving materials in a densely populated area of Rome. The researchers found that increasing the solar reflectance of roads significantly reduced surrounding air temperatures.
Lighter-coloured pavements absorb less solar radiation than traditional dark asphalt, meaning they remain cooler during hot weather and transfer less heat into the surrounding environment. These “cool pavements” help reduce surface temperatures and lower surrounding air temperatures, thus improving pedestrian comfort whilst also reducing overheating in nearby buildings.
While cool roofs, green roofs and reflective paving can all help reduce urban temperatures, they are most effective when implemented in the places that need them most. Not every street or neighbourhood experiences heat in the same way. Dense urban centres, areas with limited tree cover, large expanses of dark surfaces and neighbourhoods with vulnerable populations often experience much greater heat exposure than surrounding areas. Understanding exactly where these hotspots occur allows local authorities, developers and asset managers to prioritise investment where it will deliver the greatest benefits.
At Urban Heat Index, we help organisations identify where extreme heat poses the greatest risk. Our high-resolution urban heat maps combine detailed land surface temperature data with information about the built environment to identify neighbourhoods that are most vulnerable to overheating.
This enables local authorities, housing providers, developers and infrastructure organisations to target cool roofs and cool pavement programmes to the areas that need them most.
If you’re developing a climate adaptation strategy or looking to target investment where it will have the greatest impact, our urban heat mapping services can help you make informed, evidence-based decisions.
The London Borough of Hammersmith & Fulham has commissioned a high-resolution Urban Heat Index map to support its response to extreme heat.
The project comes during an exceptional summer. The United Kingdom recorded temperatures of at least 35°C in May, June and July 2026 for the first time. Read more at the Met Office.
Urban Heat Index combined satellite-derived surface temperatures with data on vegetation, terrain and the built environment. The resulting Geographic Information System (GIS) layer shows hotter and cooler areas in 30-metre squares across the borough.
The map also reveals the cooling influence of the River Thames, whose surface was up to 12°C cooler than the average temperature of the borough’s vegetated areas — a striking reminder of the role blue and green infrastructure plays in regulating urban temperatures.
The council will use the data to support its Climate Adaptation Strategy. Officers can combine it with local information to inform planning, housing, regeneration and measures to protect vulnerable communities.
“Environmental justice is at the heart of H&F’s approach. This data will be used alongside residents’ lived experiences and local knowledge to ensure that interventions are both evidence-based and community-informed.”
— Charlie Bone, Natural Environment Lead, London Borough of Hammersmith & Fulham
The project shows how detailed heat mapping can help councils direct cooling measures and investment towards the places that need them most.
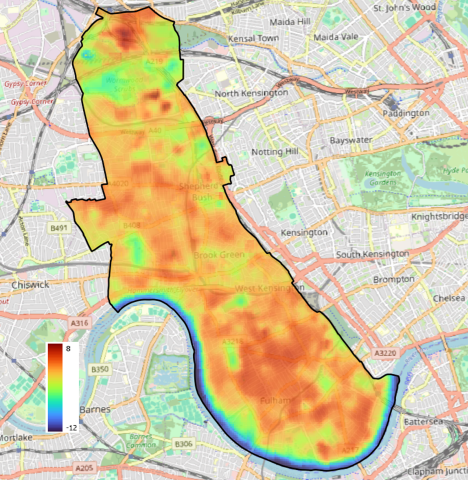
The Urban Heat Index map for Hammersmith & Fulham, showing hotter and cooler areas across the borough in 30-metre resolution.
The London Borough of Sutton has become the latest council to join Urban Heat Index’s pilot programme, commissioning a high-resolution heat map to understand how temperatures vary across the borough at the neighbourhood level.
As a suburban London borough, Sutton faces a distinct set of heat challenges. While it benefits from more green space than many inner-London areas, pockets of dense housing, high streets and industrial estates can still trap heat. Combined with London’s broader urban heat island effect — which can keep the capital several degrees warmer than surrounding countryside overnight — understanding exactly where heat builds up is critical for protecting residents.
We produced a GIS-ready data layer using satellite-derived land surface temperature, layered with data on vegetation, terrain and the built environment. But unlike a conventional hotspot analysis, this project mapped heat in both directions — identifying not only the borough’s warmest areas, but also its coolest spaces.
The first map shows areas where surface temperatures run hotter than the borough’s typical vegetated baseline, broken down to individual 30-metre pixels. These hotspots often coincide with schools, care settings and housing estates where vulnerable people live. The second map flips the lens, identifying locations that stay consistently cooler — spaces that could serve as natural refuges during heatwaves, from parks and woodlands to shaded streets and green corridors.
Together, the two maps give Sutton’s officers a powerful dual-purpose tool: a heat map to prioritise cooling interventions like tree planting and shading, and a cool map to help plan accessible community cooling spaces. Both layers integrate directly into the council’s GIS systems, supporting work across public health, planning, housing and emergency resilience.
Sutton joins a growing group of councils using high-resolution heat intelligence to move from broad climate risk assessments to practical, evidence-led action on the ground.
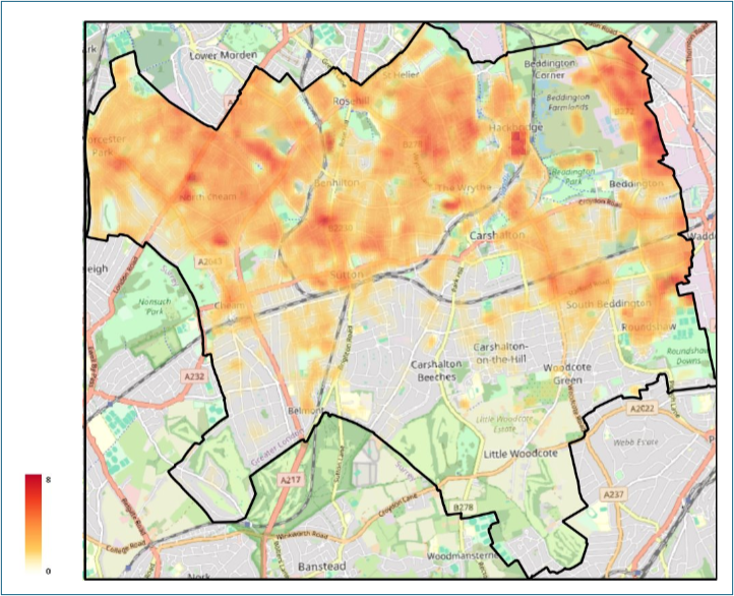
Figure 1 — Areas with a surface temperature hotter than the median temperature of cool vegetated areas.
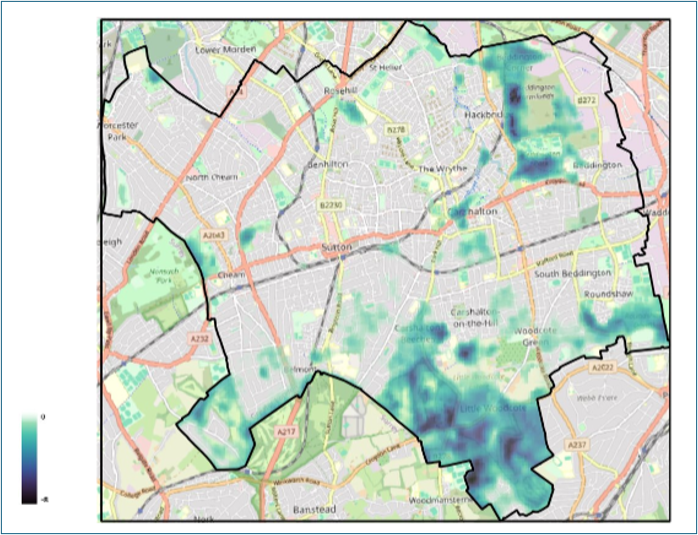
Figure 2 — Areas with a cooler surface temperature than the average of vegetated areas, helping to identify potential cooling spaces.
Portsmouth City Council has partnered with Urban Heat Index to produce a high-resolution heat map of the city, as part of our pilot programme helping local authorities prepare for rising temperatures.
Portsmouth is a densely built coastal city with a high proportion of terraced housing, care homes and schools — all of which face increasing pressure as heatwaves become more frequent. Like many councils, Portsmouth needed granular, neighbourhood-level data to understand where overheating poses the greatest risk to residents and where cooling measures could deliver the most benefit.
Working closely with the council’s planning and climate teams, we produced a GIS-ready Urban Heat Index data layer that combines satellite-derived land surface temperature with information on vegetation, terrain and the built environment. The output integrates directly into the council’s existing mapping systems, making it accessible across service areas from public health to green infrastructure planning.
The map shows noticable variation across the city, highlighting hotspots where temperatures can be several degrees higher than surrounding areas — often in neighbourhoods with limited green space, older housing stock, and higher concentrations of vulnerable people. These insights allow officers to target tree planting, shading, and retrofit programmes where they will have the greatest impact, and to build stronger evidence for funding bids and climate adaptation business cases.
Portsmouth is one of several councils taking part in our pilot programme, which is demonstrating how local authorities can move from broad climate risk assessments to actionable, street-by-street heat intelligence.
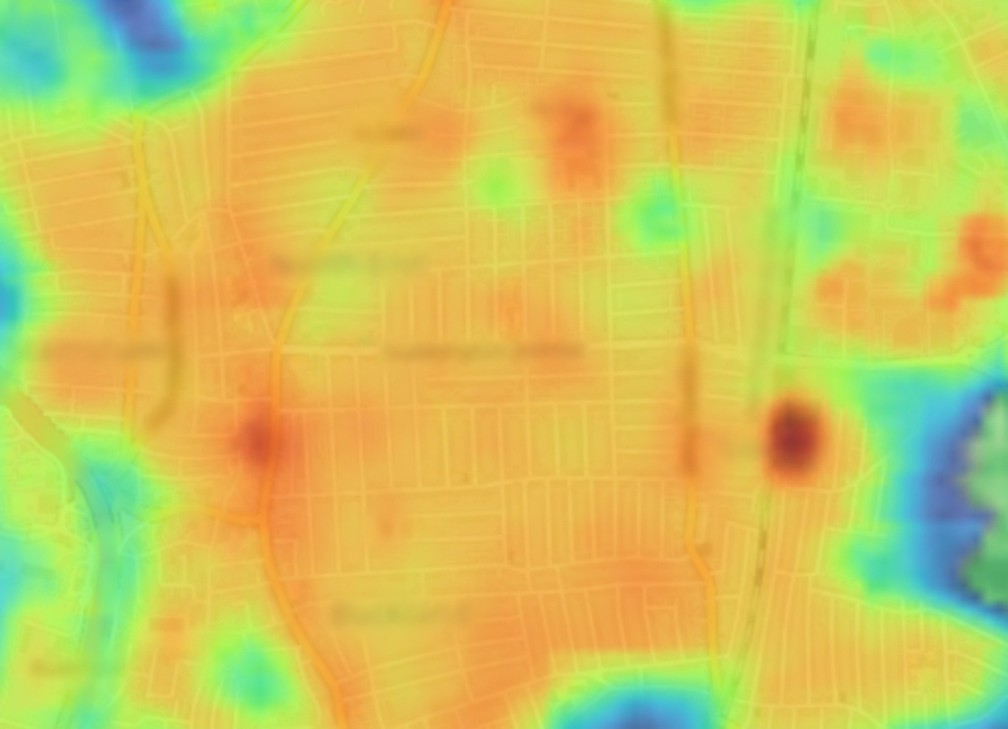
Detail from the urban heat map (place and road names intentionally blurred), showing how the map identified hot spots that would particularly benefit from interventions.
For generations, the UK has thought of itself as a temperate country. But according to the Climate Change Committee’s latest climate risk assessment, that assumption no longer holds true.
The report warns that by 2050, under current global warming trajectories, the UK’s climate will be fundamentally different from today. Summers like 2018, 2022 and 2025 — as well as the spring temperatures we’ve just experienced — were once considered exceptional. But they’re expected to become the norm. Heat risks will increase across all of the UK, and will be especially pronounced in southern England, which could see extreme heatwaves potentially reaching 45°C or more in the near future.
During the 2022 heatwave, record temperatures contributed to more than 3,000 early deaths in England and Wales. Emergency services experienced a 500% spike in 999 calls. The Climate Change Committee identifies extreme heat as the single greatest climate-related health risk facing the UK.
And yet most of our towns and cities are dangerously unprepared. Our homes, streets and infrastructure were designed for a cooler climate. Dense urban areas absorb and retain heat, creating urban heat islands where temperatures can be several degrees higher than surrounding rural areas. Vulnerable groups such as older people, young children and those with health conditions face the greatest danger.
The Climate Change Committee estimates that without further adaptation, annual heat-related deaths could rise to between 3,000 and 10,000 per year by 2050.
The good news is that many solutions already exist. The report highlights the importance of cooling measures, including urban greening, shading, ventilation improvements and targeted cooling in homes, hospitals and care settings. Crucially, it argues that adaptation must happen now, not decades from now.
But effective action depends on understanding where the risks are greatest.
That is why urban heat mapping matters. Detailed local heat data can help councils, housing providers, the NHS, developers and infrastructure operators identify overheating hotspots, prioritise investment and design more resilient places. Whether planning tree planting, retrofitting buildings or protecting vulnerable communities, accurate heat intelligence is becoming an essential part of climate adaptation.
Extreme heat is no longer a future problem for the UK. It is already reshaping how our cities function, how our buildings perform and how safely people can live through summer. The question is no longer whether we need to adapt, but whether we can adapt quickly enough.
The UK is dangerously unprepared for rising temperatures, according to the Climate Change Committee’s (CCC) latest report, A Well-Adapted UK. The report identifies extreme heat as the greatest climate-related threat to public health, warning that heatwaves will become more frequent, longer and more intense as global temperatures rise.
The CCC says annual heat-related deaths, currently estimated at between 1,400 and 3,000 during heatwave periods, could rise to as many as 10,000 a year by 2050 without urgent action. Vulnerable groups, particularly older people, face the highest risks.
By mid-century, temperatures above 40°C could become a regular occurrence in parts of southern England, while up to 92% of existing homes may overheat. The Committee is calling for stronger adaptation measures, including cooler buildings, better public health planning and investment in climate resilience to protect lives and communities from escalating heat risks.
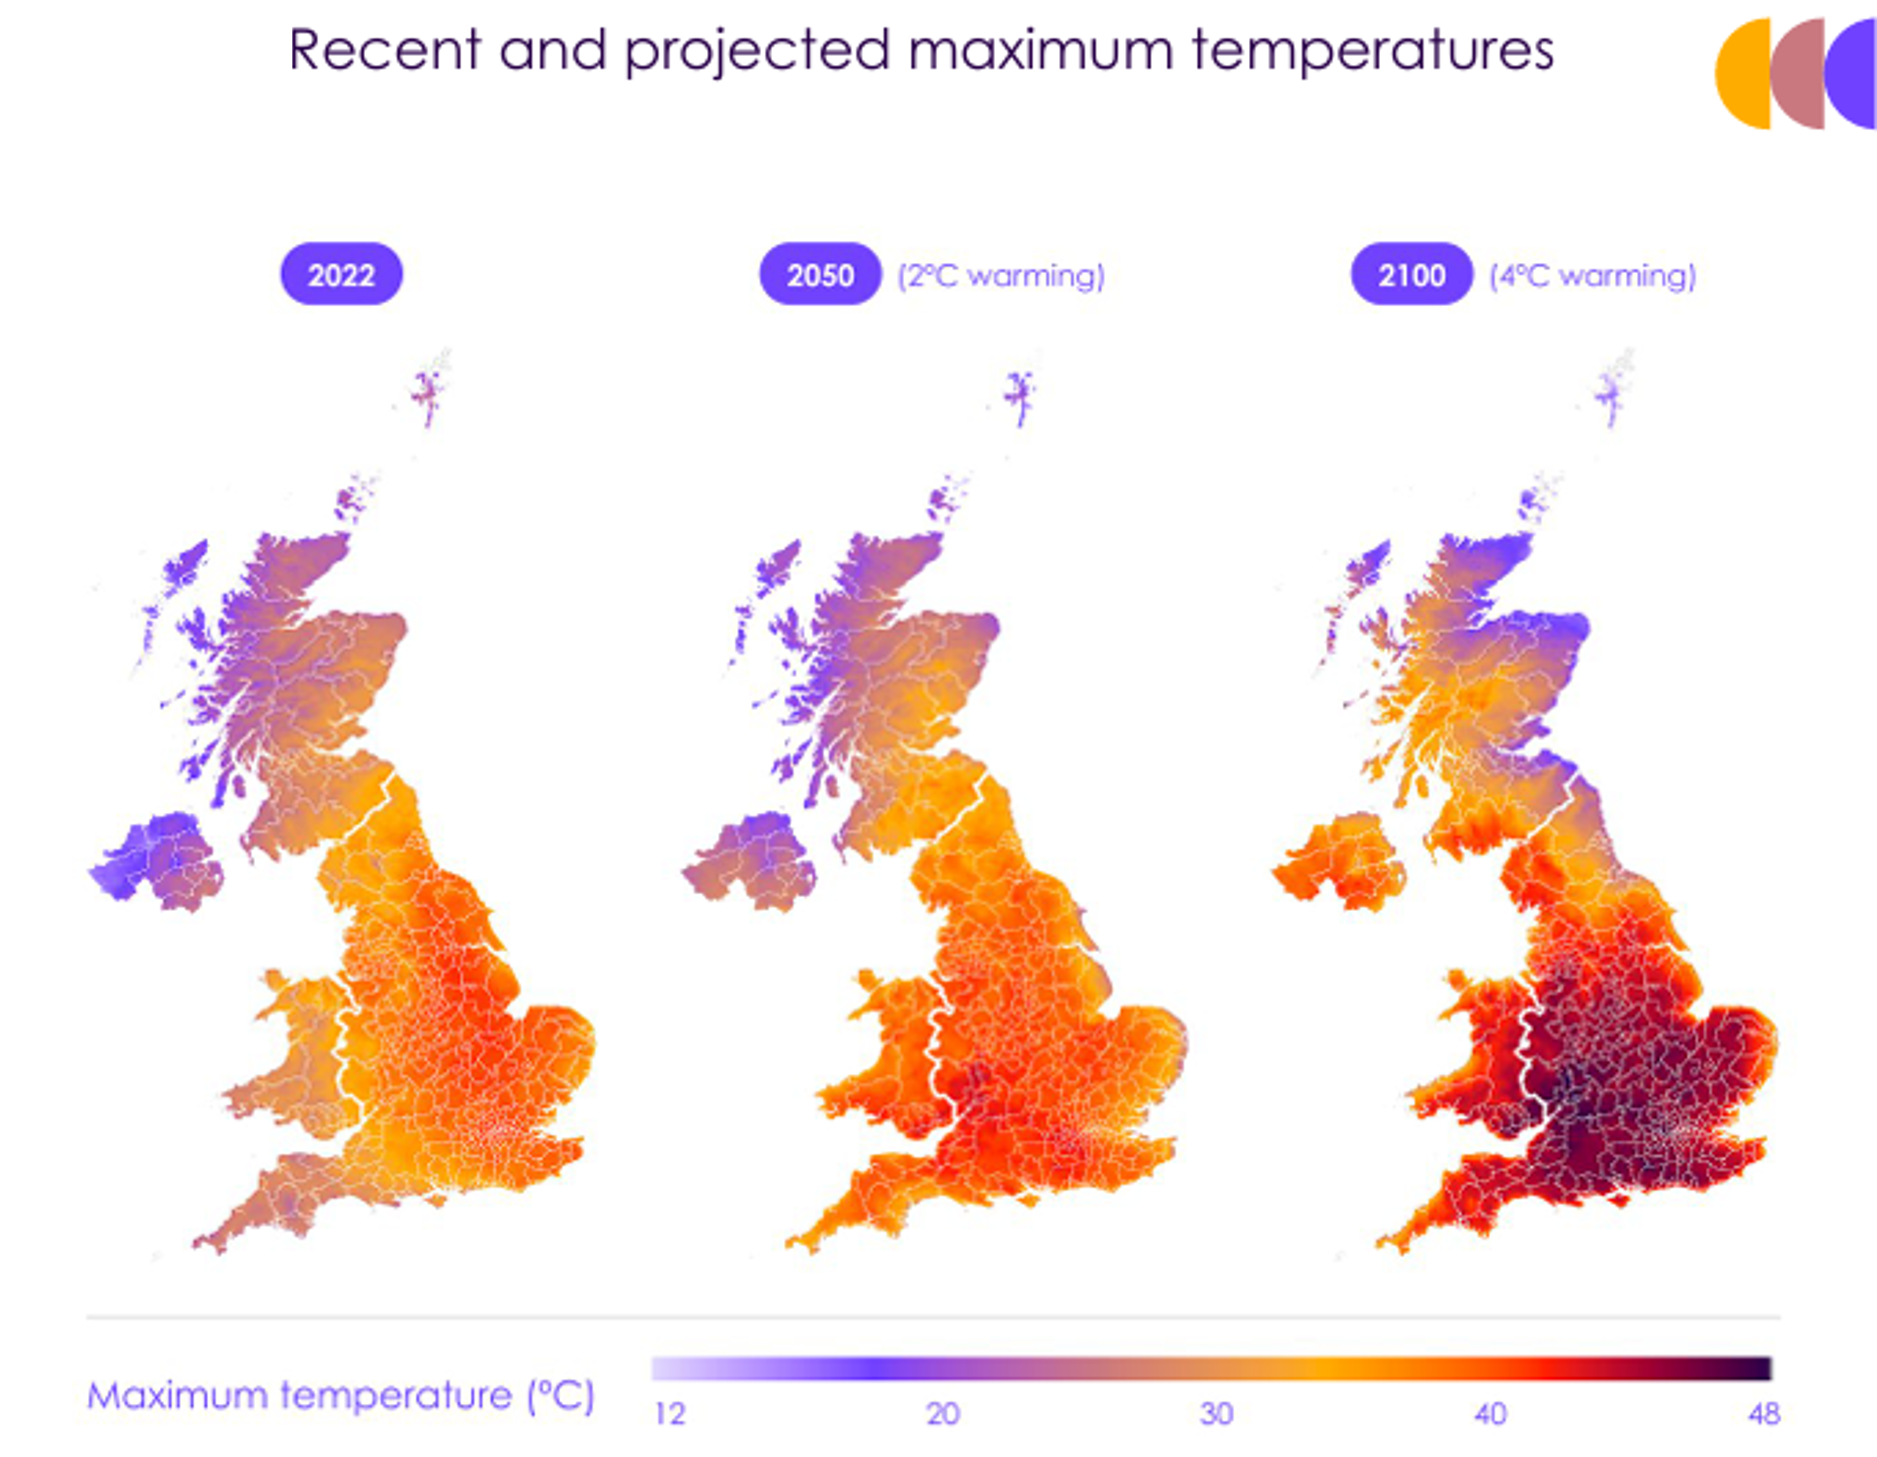
The Climate Change Committee (CCC) warns that rising temperatures will threaten the health and lives of vulnerable people. Their 2025 Adaptation Progress Report warns that heat-related deaths are likely to exceed 10,000 in an average year by 2050.
CAG Consultants and Urban Heat Index hosted the second session in our climate adaptation webinar series. In this session, we explored options for developing Urban Heat Island (UHI) maps for local authorities and other public bodies.
In this webinar, we discussed the following key topics:
This webinar was open to all local authorities and other public bodies in the United Kingdom. It was free to attend.