Our Services
Urban Heat Mapping for Local Authorities
The Urban Heat Index (UHIx) provides local authorities with detailed, street-level heat maps that turn climate and satellite data into practical, ready-to-use insights. Our service is designed for busy council teams who need clear answers without complex software.
What we deliver:
- High-resolution heat mapping using 30-metre satellite data, revealing heat variations between individual streets, parks, and city blocks — far more detailed than regional averages.
- Local context that reflects terrain, vegetation, and the built environment in your area.
- Practical outputs aligned to wards, neighbourhoods, or other local boundaries that fit your existing workflows.
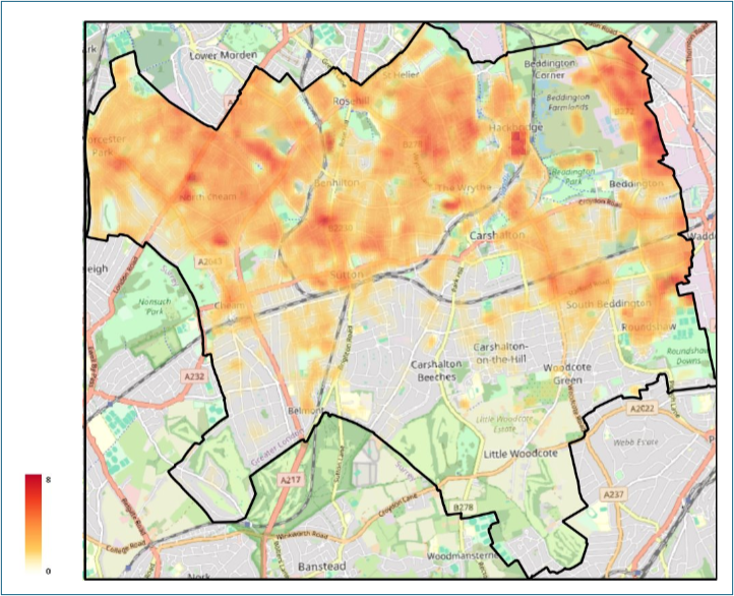
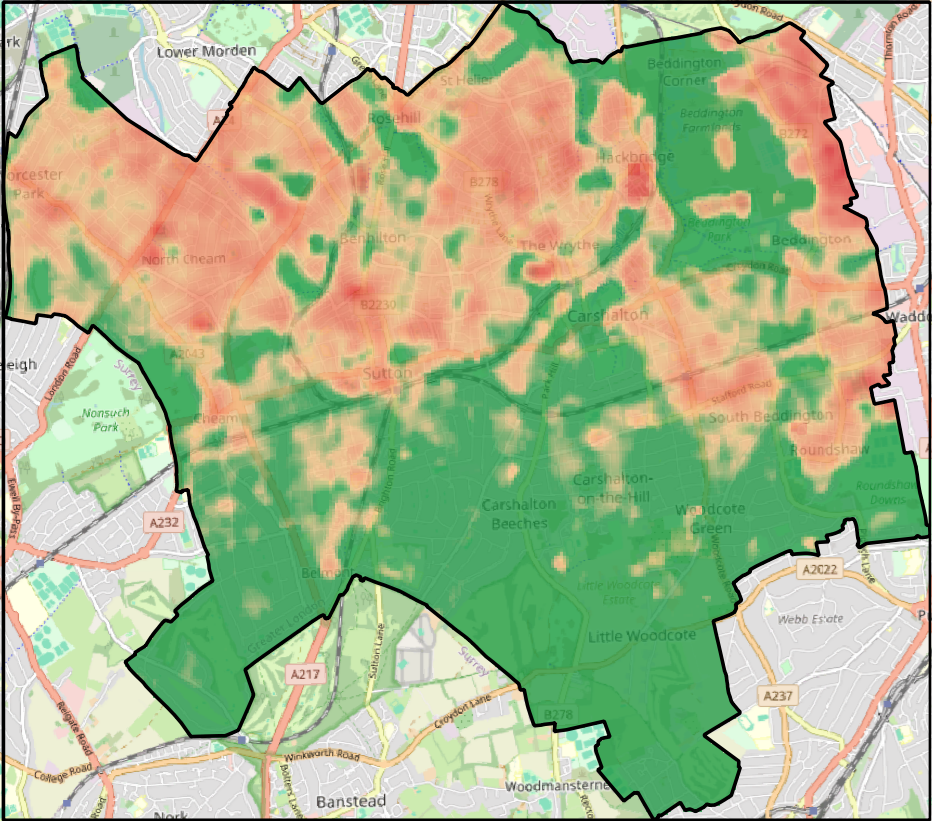
- Two core map products: a Surface Urban Heat Island (SUHI) anomaly map showing how much hotter or cooler each 30-metre pixel is compared to a cool, vegetated baseline; and an Urban Thermal Field Variance Index (UTFVI) map classifying thermal stress from "Excellent" to "Worst."
- An inception meeting to understand your existing data, agree on geographic boundaries, and align the outputs with how you intend to use them.
- Interpretation support to help you turn the data into actionable insight for planning, public health, and climate resilience decisions.
All data is delivered as ready-to-use GIS layers that can be imported directly into a Geographic Information System package such as QGIS and overlaid with your own local datasets. This allows you to compare hotter and cooler areas against education facilities, health facilities, green spaces, housing, transport routes, and other council assets. The heat layer can also be filtered to show only locations above a chosen temperature anomaly threshold, helping you concentrate on the areas with the strongest heat signal.
Councils use UHIx to pinpoint local hotspots, layer heat data with existing evidence on housing quality and vulnerability, and back investment decisions with clear evidence for adaptation and cooling measures.
Methodology
How the Urban Heat Index Works
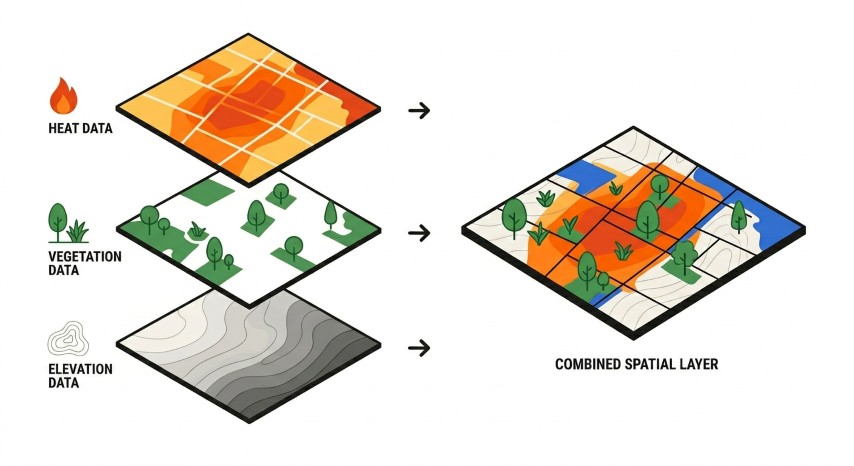
Our heat index combines satellite data on temperature, vegetation, and elevation to produce detailed urban heat maps at the local level. Our primary thermal data comes from Landsat 8 and 9 satellites, which capture land surface temperature at a 30-metre resolution, fine enough to reveal heat variations between individual streets, parks, and city blocks. We fuse this with daily temperature readings from Sentinel-3 and elevation data from the SRTM 30 m digital elevation model, creating a rich multi-sensor picture of the urban thermal environment.
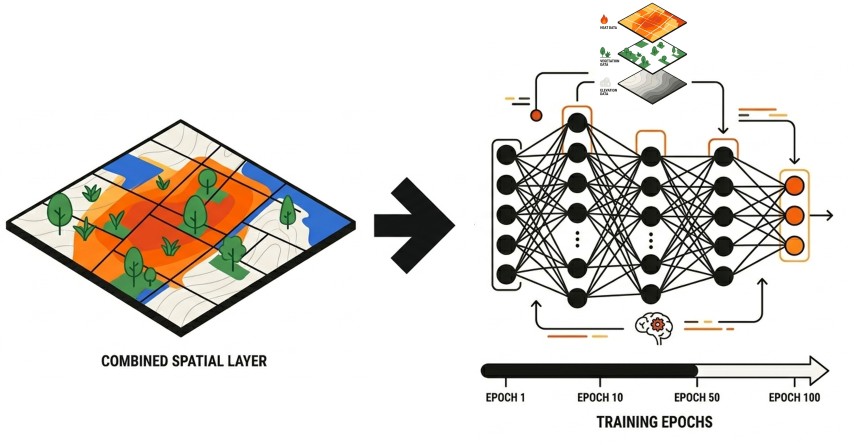
Cloud cover is a common issue when developing urban heat maps. It creates gaps in thermal satellite images. We address this using a Convolutional Neural Network (CNN). A CNN is a computer programme that analyses visual images. The programme fills the gaps caused by clouds to create complete, continuous heat maps. This process makes the data more complete for local analysis and planning.
The output is a set of ready-to-use geospatial map layers. The core product is a blended land surface temperature map in degrees Celsius, covering the full study area without cloud gaps. From this we derive two complementary metrics: a surface urban heat island (SUHI) anomaly map showing how much hotter each pixel is relative to a cool, vegetated reference baseline, and the Urban Thermal Field Variance Index (UTFVI), a dimensionless ecological indicator that classifies thermal stress into six categories from "Excellent" to "Worst." We can package this data by post codes, neighbourhoods, and other geographic boundaries.